Chapter 14 MapLibre GL JS
Last updated: 2023-01-05 18:18:21
14.1 Introduction
In this chapter, we introduce the MapLibre GL JS web mapping library. As mentioned earlier, a big advantage of MapLibre over Leaflet is the native support for vector tiles (Section 6.5.10.3).
14.2 What is MapLibre GL JS?
MapLibre GL JS is a web mapping library. It is an open-source fork of Mapbox GL JS, created in 2014, motivated by the Mapbox switching to a proprietary licence, which took place in 2020.
MapLibre GL JS is based on a very different graphical rendering technology than Leaflet:
- Leaflet uses SVG rendering (the default), or
<canvas>rendering. The main difference between the two is that with SVG rendering the vector elements (such as polygons) are drawn as<svg>HTML element, and thus accessible through the DOM, while with canvas the elements are translated to a standalone image whose “ingredients” are not directly accessible through the DOM. Both methods, however, are only able to deal with 2D graphics. - MapLibre GL JS uses WebGL rendering. Two notable advantages of using WebGL are the support of 3D graphics and hardware acceleration through the computer’s Graphics Processing Unit (GPU).
Check out Israel Hiking Map a notable open-source web mapping project in Israel, using MapLibre GL JS for its front end. The examples page in the MapLibre GL JS documentation is also a good place to start to get a sense of the library capabilities.
14.3 Custom vector tiles
One of the big advantages of using vector tiles, is the flexibility in designing, modifying, and publishing them, compared to raster tiles. As discussed earlier (Section 6.5.10.2), raster tiles are collections of raster images, typically in PNG format. Creating the huge amount of required PNG files is a time-consuming techical process that is beyind the scope of this book. Instead, we used the wide variety of pre-compiled raster tiles (see 6.5.12).
However, suppose that we need to make some minor modifications of a tile layer, such as to remove text labels of particular elements (cities, countries, etc.), change their font size, etc. With raster tiles, this would require re-generating all PNG images. Vector tiles (Section 6.5.10.3), however, are more simple to re-generate. There are several cloud service providers for hosting your own vector tiles, typically customized through a “studio” web-interface (Figure 14.1).
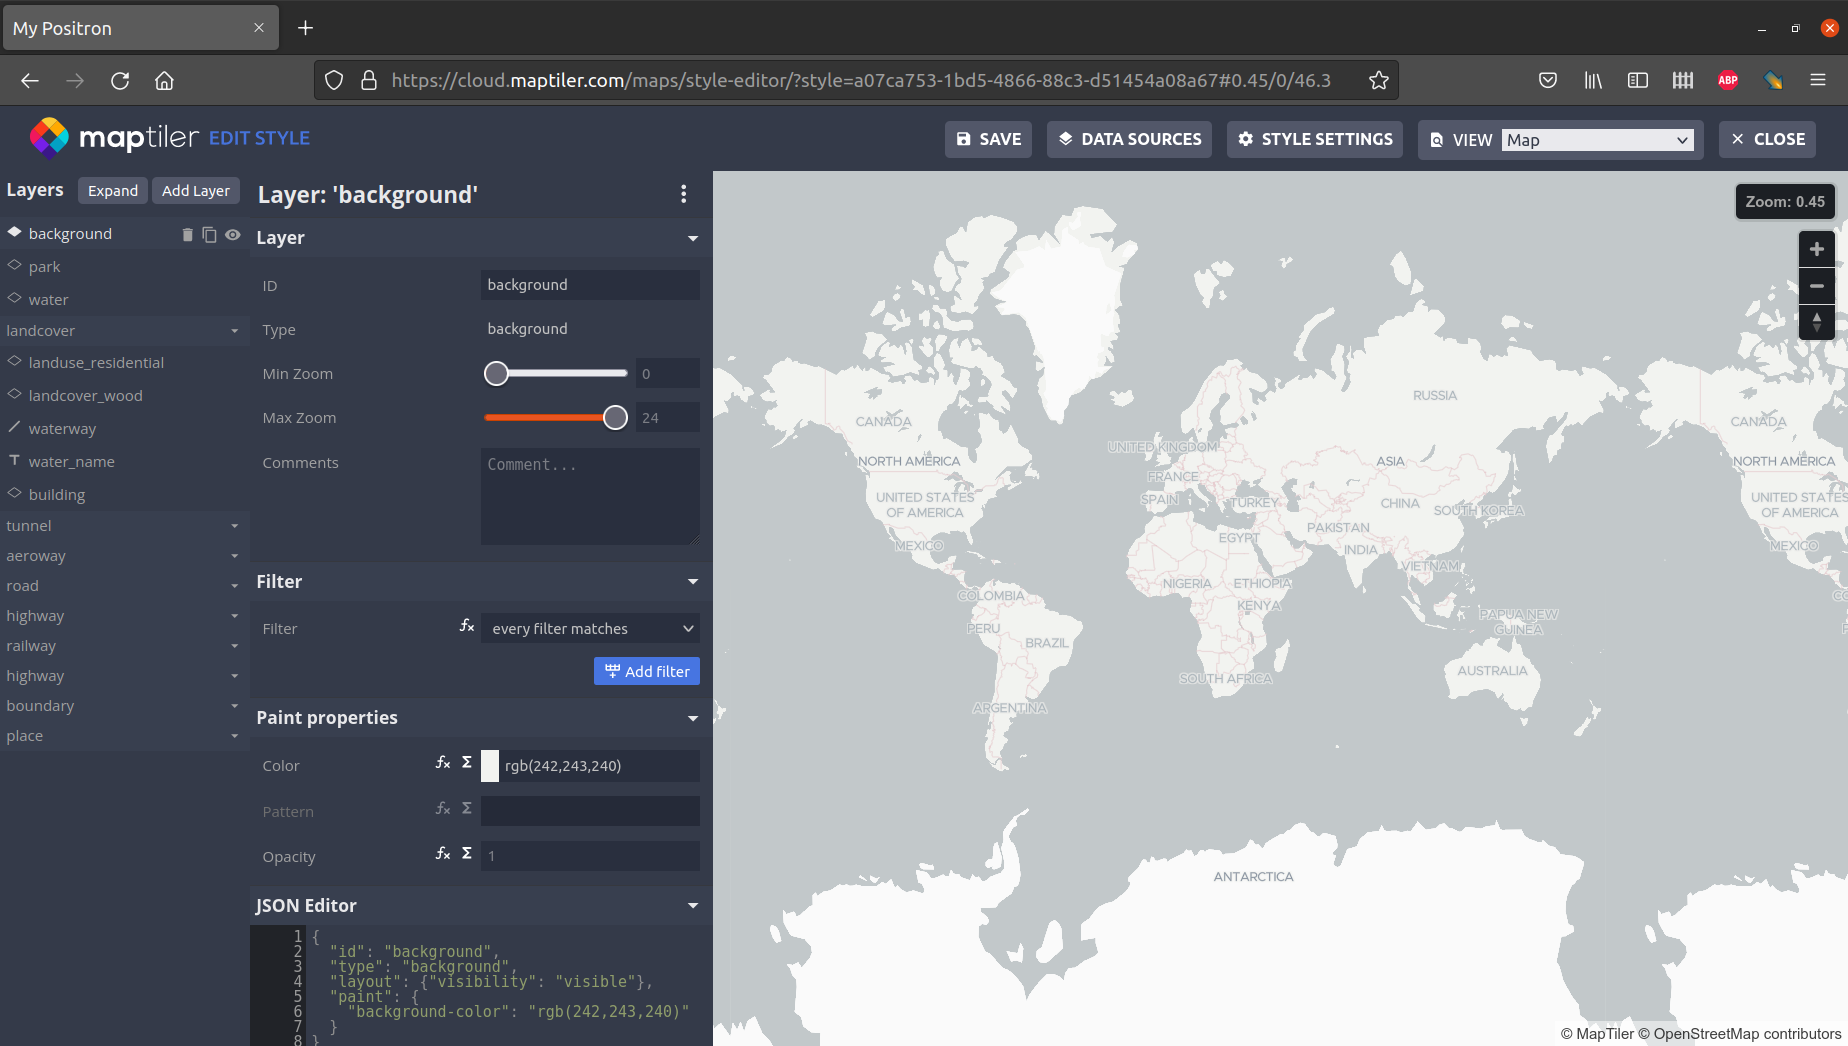
FIGURE 14.1: Customizing vector tiles on https://www.maptiler.com/
MapTiler is one such service, currently with a free plan that is sufficient for our purposes. Using the “studio” web interface (Figure 14.1), I created a modified tile set called “My Positron”, which is very similar to the “Positron” style, only with all text labels removed.
You are welcome to sign up to MapTiler and experiment with creating your own tile set to use in the examples. Once the tile set is ready, locate the “MapLibre GL JS” link, which will take you to a minimal example of a MapLibre web map using your tiles. You can copy the entire code of the map from there. Alternatively, you can copy just the URL of the tile layer (Figure 14.2) to embed in an existing MapLibre web map code.
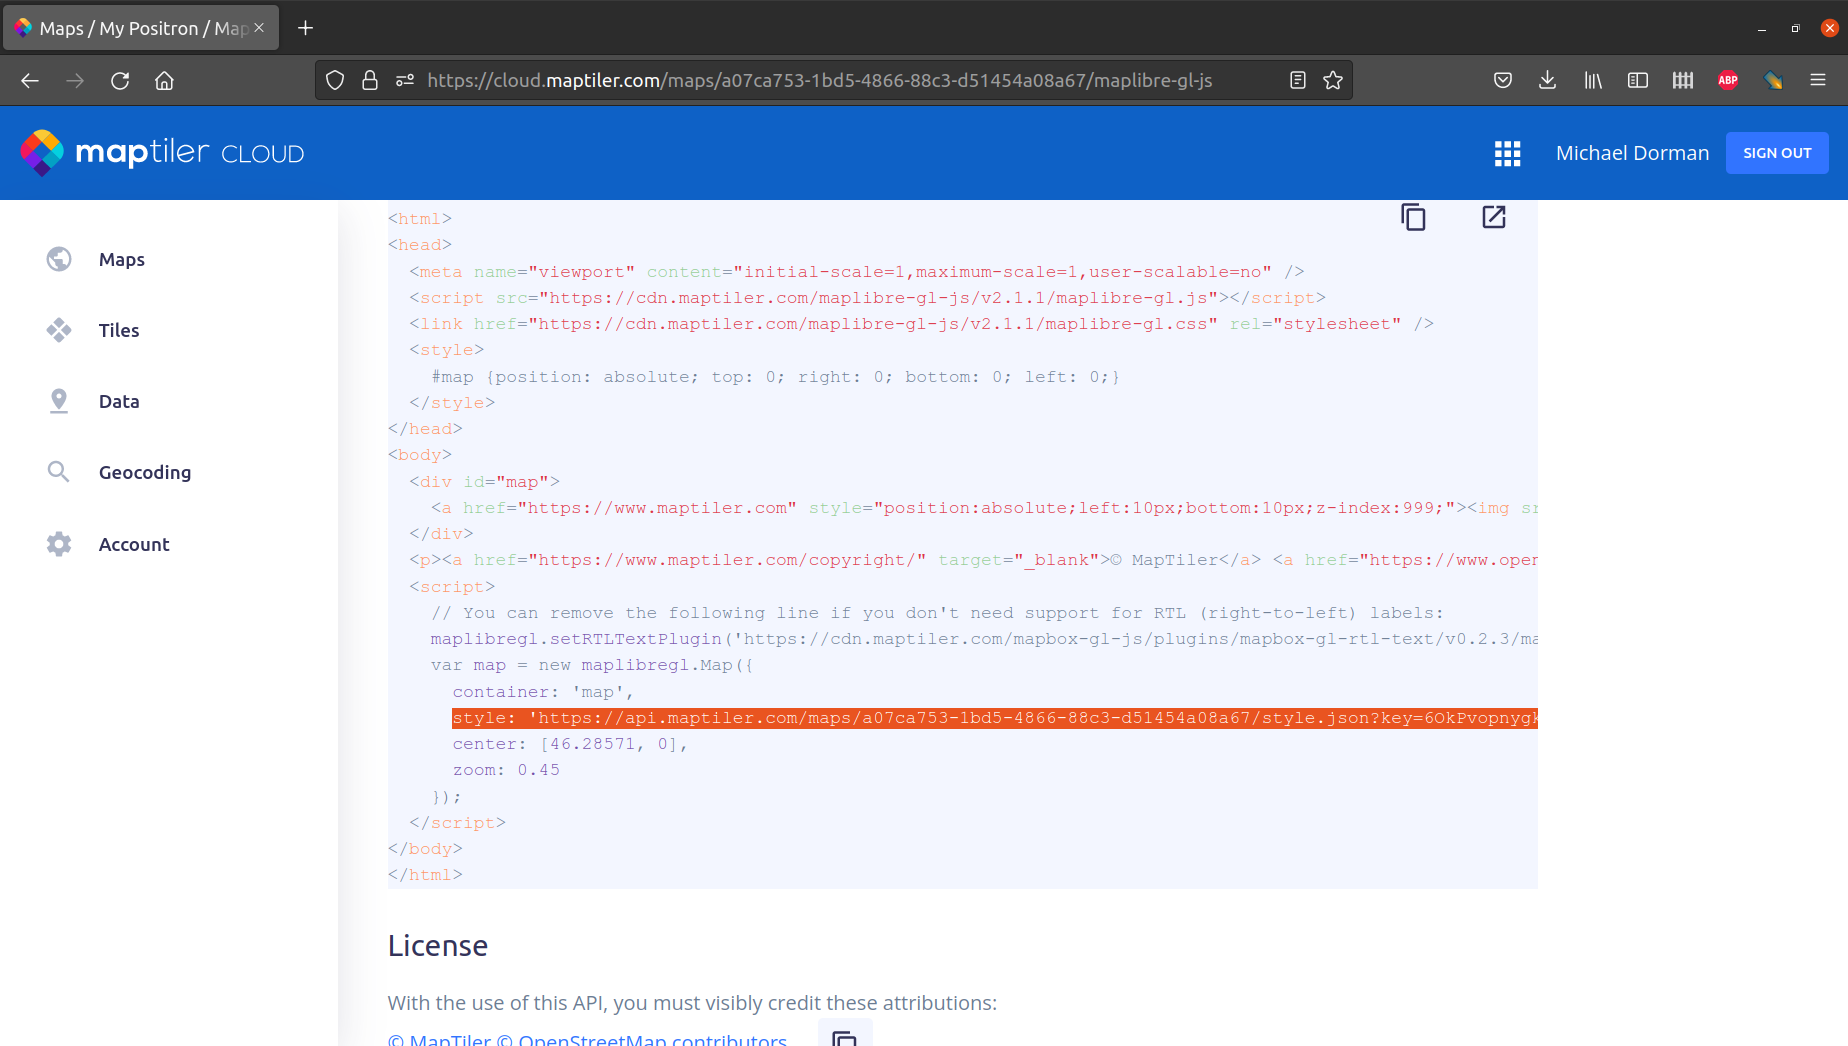
FIGURE 14.2: URL of custom vector tiles created with MapTiler, for embedding into MapLibre web map script
14.4 Initializing a map
To make a minimal MapLibre map, we need to add the following components to a minimal web page:
- Include the MapLibre JavaScript and CSS files
- Add a
<div>element to contain the map - Initialize the map inside a
<script>element
So far, you can see that the concepts are very similar to what we learned about Leaflet. However, the code itself that goes inside the <script> is different since it is specific to MapLibre.
First, we have to include the MapLibre JavaScript and CSS files. Use the URLs provided in the documentation:
- https://unpkg.com/maplibre-gl@2.4.0/dist/maplibre-gl.js
- https://unpkg.com/maplibre-gl@2.4.0/dist/maplibre-gl.css
or download the files and use a local copy, which is what we will do:
<script src="js/maplibre-gl.js"></script>
<link rel="stylesheet" href="css/maplibre-gl.css">
Next, we need to include a <div> element to contain the map, similarly to what we did with Leaflet (Section 6.5.8). The <div> contains an internal <a> element with the MapTiler logo and link108, as instructed when creating the tiles (Section 14.3):
<div id="map">
    <a href="https://www.maptiler.com" style="[...]">
        <img src="[...]/logo.svg" alt="MapTiler logo">
    </a>
</div>
The <style> element contains a corresponding specification to control the placement of the <div>:
#map {
    position: absolute;
    top: 0;
    right: 0;
    bottom: 0;
    left: 0;
}
Finally, inside the <script>, we include the following expression to initialize the map, using maplibregl.Map:
let map = new maplibregl.Map({
    container: 'map',
    style: 'https://api.maptiler.com/maps/openstreetmap/[...]',
    center: [34.801472, 31.262218],
    zoom: 17
});
Conceptually, this is similar to the way we initialized a Leaflet map (Section 6.5.9). In both cases, the expression applies JavaScript code to “fill” the contents of the <div> with the interactive map. One notable difference is that the (vector) background in MapLibre GL JS is initialized as part of the map creation through the style property, rather than as a separate step as in Leaflet (Section 6.5.11). The style property accepts a JSON specification of the vector background, obtained from the MapTiler interface (Section 14.3). The supplied JSON document specifies the source of the vector tile data as well as their visual styling. The JSON file is typically obtained from graphical editors, such as the MapTiler “studio” (Section 14.3), rather than edited by hand. Note that the URL contains an API key, used by MapTiler to associate map loads with a particular user account.
The important properties passed to maplibregl.Map are as follows:
container—The id of the<div>in which the map will be initizlized, such as"map"in our examples.style—The style URL of the map style being used to determine which tilesets the map includes and how they are styled. The example above uses the Mapbox Streets v11 style.center—The coordinates of the map center, as[lon, lat].zoom—The zoom level at which the map is initialized, a whole number or a decimal value.
Check out the Map object documentation for the complete list of map initialization options.
The resulting minimal MapLibre GL JS map is shown in Figure 14.3.
FIGURE 14.3: example-14-01.html (Click to view this example on its own)
14.5 Adding GeoJSON
Other than a tile layer, as map backgroud, we usually want to display our own data in the foreground (Section 6.2). Typically, the foreground layer is passed as GeoJSON (Section 7).
The first thing to do, before we go on, is to add an event listener for map load. MapLibre GL JS is designed in such a way that:
- map load is asynchronous (see Section 7.7.1), meaning that subsequent expressions can be executed while the map is being initialized, however
- we cannot modify the map (such as add another layer) until before it is fully loaded (otherwise we get a
Style is not done loading.error)
The map load event listener deals with the situation, making sure that anything we do with the map object takes place only after it is completely loaded:
map.on('load', function() {
    ...  // Changes and additions to the map go here
});
Inside the map load event listener, we insert three expressions, which are all methods of the map object:
map.addControl—Add a navigation control on the mapmap.addSource—Add a new data source for the map, in this case a GeoJSON filemap.addLayer—Add a new layer to display on the map, in this case a GeoJSON layer, using the source defined earlier
The event listener thus has the following structure:
map.on('load', function() {
      map.addControl(new maplibregl.NavigationControl());
      map.addSource(...);
      map.addLayer(...);
    });
The .addControl expression is short and straightforward, so we move on to .addSource and .addLayer. MapLibre GL JS has the separate concepts of data sources, where we specify the data, and layers, where we specify how the data are translated to graphics we see on screen. These correspond to the .addSource and .addLayer methods.
When adding a GeoJSON data source, we use the .addSource method as follows:
map.addSource('stat_data', {
    'type': 'geojson',
    'data': 'data/stat.geojson'
});
The first argument inside .addSource is an ID of our choice, such as stat_data. The ID is used later on in our script, when adding a layer based on a particular data source. The second argument is a set of options, most importantly:
type—The source type,'geojson'for GeoJSON data sourcesdata—The GeoJSON data, either a URL of a GeoJSON file (such as'data/stat.geojson') or an inline GeoJSON object
Next, using the .addLayer method we actually display the GeoJSON data on the map. The .addLayer method controls the way that the GeoJSON data are translated to a visual layer, using the following parameters:
id—An ID of the layer, which we may use later on in our script to refer to that layer, such asstat_layertype—The layer type; for polygon data, we demonstrate the'fill'type (here) and the'fill-extrusion'type (Section 14.7)source—The ID of the data source underlying the layer, such as'stat_data'paint—The styling/symbology of the layer
The first three properties—id, type, and source—are straightforward. The third property, paint, is more complicated. The paint property determines the visual appearance, or symbology, of the layer. The simpler scenario is when we set fixed symbology for all features. In that case, we need to pass an object of property:value pairs, with all of the properties where we choose to override the default, similarly to the style property in Leaflet (Section 8.3).
The valid properties inside paint depend on the type, and are listed in the MapLibre GL JS documentation. For example, in layers of type fill, we can specify (among others):
'fill-outline-color'—Polygon outline color (such as'black')'fill-color'—Polygon fill color (such as'blue')'fill-opacity'—Polygon opacity, a numeric value between0and1(such as'0.5')
The complete event listener code is:
map.on('load', function() {
      map.addControl(new maplibregl.NavigationControl());
      map.addSource('stat_data', {
        'type': 'geojson',
        'data': 'data/stat.geojson'
      });
      map.addLayer({
        'id': 'stat_layer',
        'type': 'fill',
        'source': 'stat_data',
        'paint': {
          'fill-outline-color': 'black',
          'fill-color': 'blue',
          'fill-opacity': 0.5
        }
        });
    });
The resulting map, now with a GeoJSON layer in the foreground, is shown in Figure 14.4.
FIGURE 14.4: example-14-02.html (Click to view this example on its own)
14.6 Symbology and popups
In this section, we are going to enhance the statistical areas map (Figure 14.4) with two additional components, which are probably the most essential in a typical web map:
- Variable symbology
- Popups
Let us start with the variable symbology. To have variable symbology, according to a property in the GeoJSON data, we can replace the 'fill-color':'blue' entry (Section @ref()) with the following one:
'fill-color': [
    'interpolate',
    ['linear'],
    ['get', 'density'],
    0, '#fef0d9',
    865, '#fdcc8a',
    2287, '#fc8d59',
    7754, '#e34a33',
    14965, '#b30000'
]
In plain language, the above expression means that fill colors are linearly interpolated ('interpolate', 'linear'), according to the density property ('density') taken as is ('get'). Interpolation takes place between the specified breaks and colors. This expression follows the rules of MapLibre “expression language”. The expression language can be used to specify various relations between the values in GeoJSON properties and visual properties such as size or color.
Next, we introduce the following code section, which adds an event listener to display popups:
map.on('click', 'stat_layer', function(e) {
    let coordinates = e.lngLat;
    let description =
        '<div class="popup">' +
        e.features[0].properties.YISHUV_STAT11 + "<br>" +
        e.features[0].properties.SHEM_YISHUV + "<br>" +
        Math.round(e.features[0].properties.density) + ' km<sup>-2</sup>' +
        '</div>';
    new maplibregl.Popup()
        .setLngLat(coordinates)
        .setHTML(description)
        .addTo(map);
});
The outer part is the event listener definition:
map.on('click', 'stat_layer', function(e) {
    // What to do on click
});
meaning that the given function is executed whenever the user clicks on the statistical areas layer, specified with the ID stat_layer. Note that the function accepts the event object e as an argument. Inside the function, there are three expressions:
- Getting the click location
coordinates(to display the popup at that location) - Setting the popup contents
description - Displaying the popup
Conceptually, the code is similar to the way that we set a map click event with Leaflet (Section 6.9). Note that the even object e contains the click coordinates e.lngLat as well as the touched features e.features. The former is used to determine where to display the popup, while the latter is used to construct the popup contents.
The result is shown in Figure 14.5.
FIGURE 14.5: example-14-03.html (Click to view this example on its own)
Check out the Visualize population density and Show polygon information on click examples of adding symbology and popups, respectively, in the MapLibre GL JS documentation. Also see the Make a choropleth map tutorial from Mapbox about symbology in Mapbox GL JS (which also applies to MapLibre GL JS). The tutorial also demonstrates adding a legend to the map, which we will not go into here.
14.7 3D extrusions
Our final example demonstrates displaying 3D data on a web map. Importantly, this next example is impossible to do with Leaflet. In the example, we are going to display town polygons, but in addition to coloring them according to population density, we are also going to extrude them according to the same property (Figure 14.6). It can be argued whether extrusion height is easier to interpret than fill color or not, a 3D map is definitely attractive and interesting to play with.
Compared with example-14-03.html (Section 14.6), other than switching to a differenty data source, towns.geojson instead of stat.geojson, the differences are inside the .addLayer method. First, instead of 'type':'fill', the layer definition is now 'type':'fill-extrusion'. This means that in addition to being colored, the polygons are also “elevated”, i.e., extruded, to a specified height in the Z dimension. Second, the 'paint' property of .addLayer now specifies two variable properties:
'fill-extrusion-color''fill-extrusion-height'
instead of just 'fill-color' in example-14-03.html. The 'fill-extrusion-color' specification is identical to the one we used for 'fill-color', linearly interpolating between five specified break points and colors. The 'fill-extrusion-height' determines the extrusion height, in meters. In this case, we take the population density as is, using the expression ['get','density']. In case we needed to tweak the heights, we could use a more complicated expression such as ['*', 3, ['get', 'density']] (what do you think will be the effect?).
The complete .addLayer expression is as follows:
map.addLayer({
    'id': 'towns_layer',
    'type': 'fill-extrusion',
    'source': 'towns_data',
    'paint': {
        'fill-extrusion-color': [
            'interpolate',
            ['linear'],
            ['get', 'density'],
            0, '#fef0d9',
            865, '#fdcc8a',
            2287, '#fc8d59',
            7754, '#e34a33',
            14965, '#b30000'
        ],
        'fill-extrusion-height': ['get', 'density'],
        'fill-extrusion-opacity': 0.9,
        'fill-extrusion-base': 0
    }
});
The result is shown in Figure 14.6.
FIGURE 14.6: example-14-04.html (Click to view this example on its own)
Here are a few more interesting examples from the MapLibre GL JS documentation, demonstration some of its capabilities:
- Animate map camera around a point
- Create a heatmap layer
- 3D Terrain
- Display buildings in 3D
- Extrude polygons for 3D indoor mapping
- Animate a series of images
- Animate a marker
- Animate a line
and here are few more basic examples which are useful for learning about how to use the library:
- Display a map
- Display map navigation controls
- Set pitch and bearing
- Add a default marker
- Add a GeoJSON line
- Add a GeoJSON polygon
- Add a raster tile source
- Add a vector tile source
- Create a draggable Marker
- Add a WMS source
- Add custom icons with Markers
- Add multiple geometries from one GeoJSON source
- Display a popup
- Display a popup on hover
- Locate the user
- Get coordinates of the mouse pointer
- Measure distances
- Show drawn polygon area
- Create a hover effect
- Show polygon information on click
- Get features under the mouse pointer
- Style lines with a data-driven property
- View a fullscreen map
14.8 Exercise
- Check out the Add an animated icon to the map example in the MapLibre GL JS documentation. The example creates a custom animated circle image, and displays it at the location specified using GeoJSON. Adapt this example to display real-time locations of earthquakes, by going through the following steps.
- Create a copy of the example HTML.
- Go over the
<script>and locate the place where the source data for the point location is determined. Replace it with the GeoJSON of real-time earthquake locations (see Section 7.8.2). - You will see that some of the earthquakes are not shown, since MapLibre GL JS hides overlapping images by default. Use the
'icon-allow-overlap'property (inside'layout'!) to make sure that all earthquakes are displayed, regardless of overlap. - Add a
'click'even listener to display earthquake location and magnitude inside a popup. Use theplaceandmagproperties in the GeoJSON, respectively. - Change web page
<title>to “Animated earthquakes”.
FIGURE 14.7: solution-14.html (Click to view this example on its own)
Parts of the style specification and URL were replaced with
[...]to save space.↩︎