Introduction to Web Mapping
Preface
Last updated: 2023-01-05 18:18:18
0.1 What is web mapping?
A web map is an interactive display of geographic information, in the form of a web page, that you can use to tell stories and answer questions. In the past, most digital geographic information was confined to specialized software on desktop PCs and could not be easily shared. With the advent of web mapping, geographical information can be shared, visualized, and edited in the browser. The most important advantage to this is accessibility: a web map, just like any website, can be reached by anyone from any device that has an internet browser and an internet connection.
Web maps are interactive. The term interactive implies that the viewer can interact with the map. This can mean selecting different map data layers or features to view, zooming into a particular part of the map that you are interested in, inspecting feature properties, editing existing content, or submitting new content, and so on.
Web maps are also said to be powered by the web, rather than just digital maps on the web. This means that the map is usually not self-contained; in other words, it depends on the internet. At least some of the content displayed on a web maps is usually loaded from other locations on the web, such as a tile server (Section 6.5.10.2).
Web maps are useful for various purposes, such as data visualization in journalism (and elsewhere), displaying real-time spatial data, powering spatial queries in online catalogs and search tools, providing computational tools, reporting, and collaborative mapping. Some examples of web maps used for different purposes are given in Table 0.1. All of these are built with JavaScript.
| Purpose | Example | Notes |
|---|---|---|
| Visualization and journalism | Global Migration | |
| Ship Traffic | ||
| Israel Municipalities | ||
| NYC Planning | ||
| Real-time information | Earth Weather | Figure 0.1 |
| Real-Time Flight Locations | ||
| Global Forest Watch | ||
| Israel 24th Elections | ||
| Catalog and search | Earth Data Search | |
| Computational/mapping tools | Google Maps | |
| Israel Hiking Map | ||
| SunCalc | ||
| geojson.io | see Section 7.4.1 | |
| mapshaper | see Section 7.4.2 | |
| Route Planner | ||
| Reporting and collaboration | OpenStreetMap | see Section 13.2 |
| Falling Fruit |
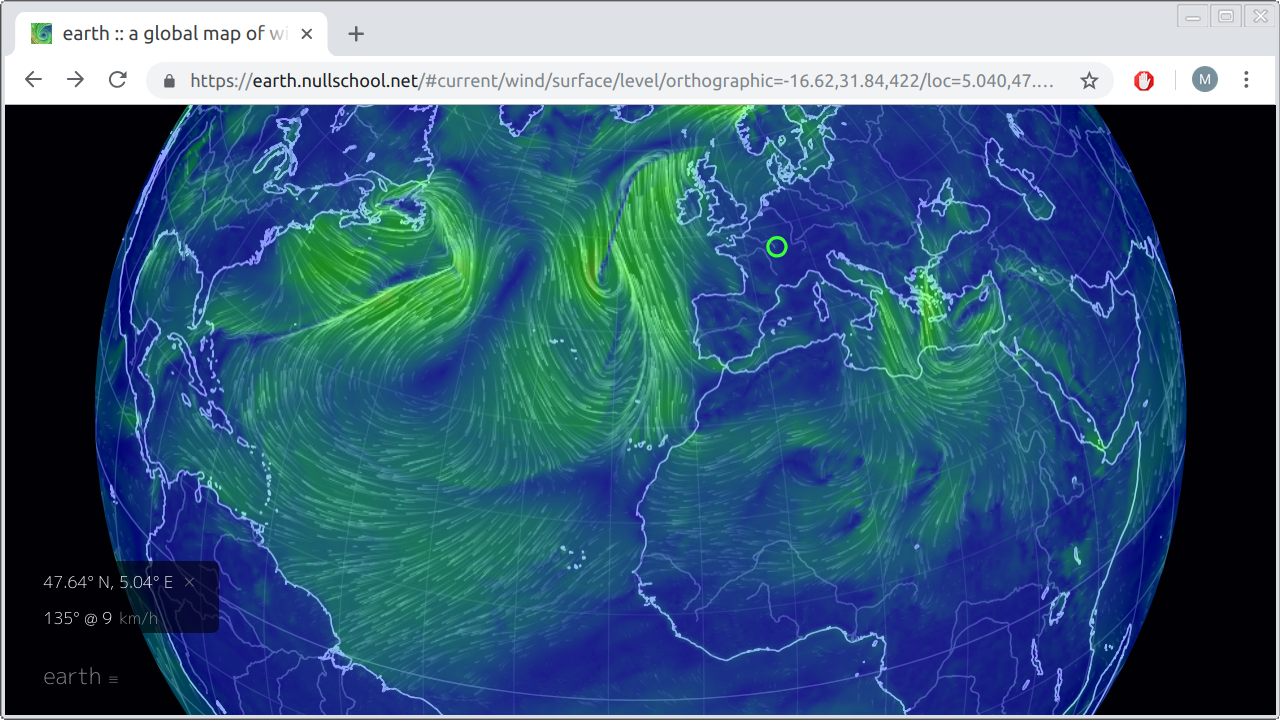
FIGURE 0.1: Real-time earth weather visualization on https://earth.nullschool.net
0.2 What is JavaScript?
JavaScript is a programming language, primarily used to control interactive behavior in web pages. Alongside HTML and CSS, JavaScript is one of the three core technologies of the web. JavaScript is the only programming language that can run in the web browser, and it is used by ~95 percent of websites. The importance of the internet thus makes JavaScript one of the most popular programming1 languages (Figure 0.2).
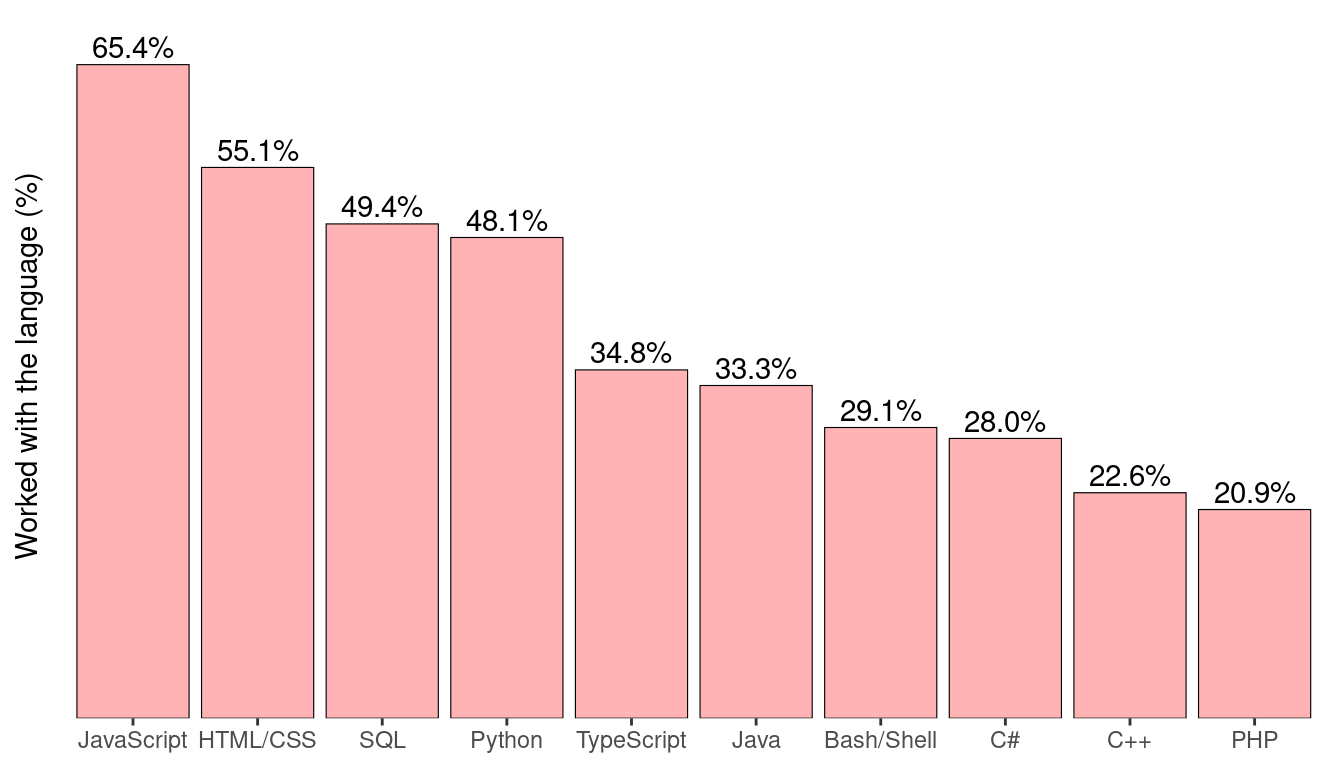
FIGURE 0.2: Programming language popularity, based on the StackOverflow survey for 2022
JavaScript and web development are huge topics. In this book, we are going to learn JavaScript from the specific point of view of web mapping.
0.3 Why use JavaScript for web mapping?
The availability of code-free, graphical interfaces for making sophisticated web maps remains an ongoing goal for the web-mapping community. Several platforms now provide straightforward interactive interfaces for building and publishing web maps and web-mapping applications, such as:
A more customizable, programmatic approach for building web maps is available through scripting languages such as R and Python. Both languages have libraries that give the ability to build web maps, using few lines of code and incorporating data from the user environment:
All of the above eventually build HTML, CSS, and JavaScript code, with varying degrees of flexibility and customization.
Nevertheless, proficiency in the fundamental web technologies HTML, CSS, and JavaScript eventually allows web cartographers to control all low-level properties of the web map they are building. That way, the user experience of web maps can be enhanced and customized beyond what is provided by either of the above “indirect,” or high-level, approaches. For example, the Leaflet web mapping JavaScript library has a wide range of plugins and extensions, mostly unavailable in external tools and libraries unless using it directly, through JavaScript coding (Sections 13.3 and 12.6).
0.4 Learning objectives
By the end of this book, you will be able to:
- Build and publish basic websites and web maps
- Use JavaScript to add interactive behavior in your maps
- Connect you web map to a database to display large amounts of data
- Include client-side geoprocessing functionality in your web map
- Gain an understanding on how the web works, and a starting point for learning more
0.5 Software
The field of web mapping, much like web development as a whole, is rapidly changing. The book thus intends to emphasize established technologies, libraries, and principles which are unlikely to go away soon. These include HTML, CSS, JavaScript, Leaflet, GeoJSON, Ajax, and PostGIS (Figure 0.3).
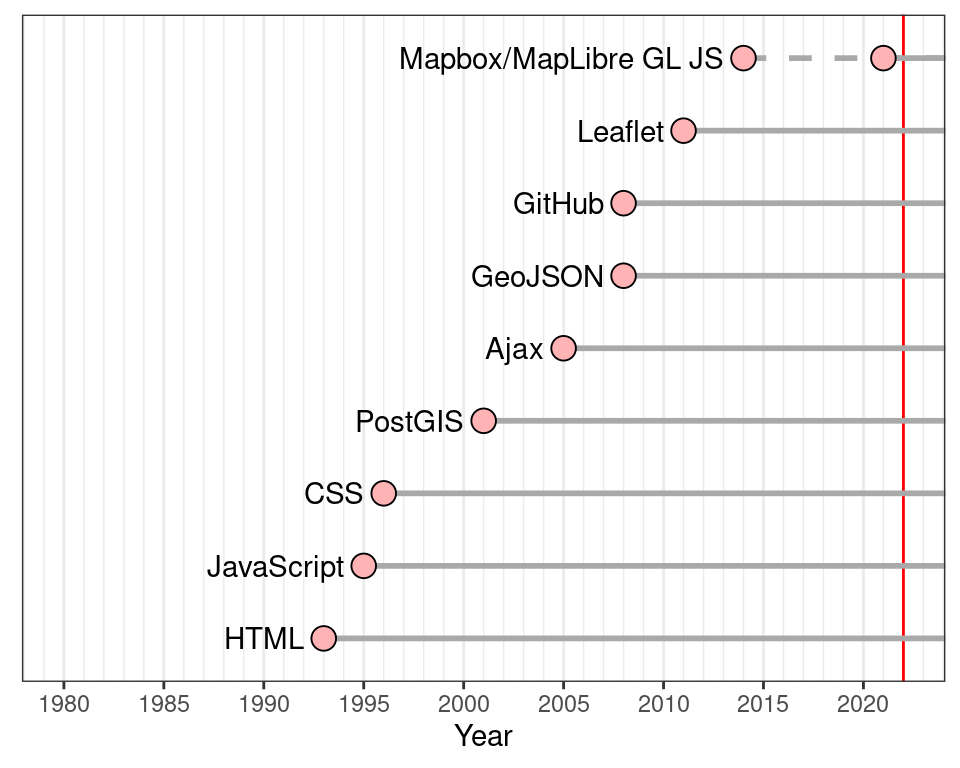
FIGURE 0.3: Initial release time of technologies and platforms used in the book (release year data from Wikipedia)
Throughout the book, we are going to use the following software components, which are freely available on the web:
- A plain text editor, such as:
- A modern web browser2:
- Web developer tools (built into Chrome and Firefox)
- A local web server (built into Python, other options are available)
We will introduce and demonstrate five open-source JavaScript libraries, as listed on Table 0.2. The newest versions of these libraries, at the time of writing (September 2022), are being used throughout the book. The online version of the book (Section 0.8) includes copies of those specific library versions, which you can download to make sure the examples from the book are reproducible, even if newer versions of the libraries will introduce conflicting changes in the future.
| Library | Version | Released | URL |
|---|---|---|---|
| Leaflet | 1.9.2 | 2022-10-04 | https://leafletjs.com/ |
| Turf.js | 6.5.0 | 2021-07-10 | https://turfjs.org/ |
| Leaflet.heat | 0.2.0 | 2015-10-26 | https://github.com/Leaflet/Leaflet.heat |
| Leaflet.draw | 1.0.4 | 2018-10-24 | https://github.com/Leaflet/Leaflet.draw |
| MapLibre GL JS | 2.4.0 | 2022-08-27 | https://maplibre.org/maplibre-gl-js-docs/api/ |
While emphasizing open-source solutions, we will also demonstrate one commercial service (which can be used for free for our purposes), namely GitHub, chosen for its simplicity.
Several datasets from the book are also demonstrated using the QGIS software (Figures 8.3, 9.2), but it is not essential to be familiar with QGIS, or any other geographic information system (GIS) software, to follow the material.
0.6 Datasets
The examples in this book use several sample datasets (Table 0.3), which can be downloaded from the online version (Section 0.8).
| File | Description | Date | URL |
|---|---|---|---|
county2.geojson (county2_2p.geojson) |
US counties | 2017 | https://www.census.gov/data.html |
person.json |
Basic JSON example | ||
plants.geojson |
Rare plant observations | 2016 | https://redlist.parks.org.il/plants/observations/ |
stat.geojson (towns.geojson) |
Israel statistical areas | 2022 | https://www.cbs.gov.il/ |
The file county2_2p.geojson is derived from county2_2p.geojson by means of simplification, as explained in Section 7.4.2. The file towns.geojson is derived from stat.geojson by dissolving (aggregating) from statistical area to town-level division and summing total population per town.
0.7 Background knowledge
The book can be used as primary text for a web-mapping course in geography departments, or by anyone who is interested in the topic. Each of the fourteen chapters is designed to be covered in a three-hour lecture, or through self-study. Short questions and exercises are given throughout the chapters to demonstrate the material from different angles and facilitate understanding. There are also concluding exercises with complete solutions (Appendix C) at the end of Chapters 3–4, 6–12, and 14.
Familiarity with basic concepts of geographic data and GIS (coordinate systems, projections, spatial layer file formats, etc.) is necessary for deeper understanding of some of the topics in the book. Readers who are not familiar with GIS can skip the theoretic considerations and still follow the material from the technical point of view.
The book assumes no background knowledge in programming or web technologies (HTML, CSS, JavaScript), going through all necessary material from the beginning. Previous experience with programming (e.g., using Python or R) and using databases (SQL) is beneficial, but not required.
0.8 Online version
The online version of this book is freely available, with agreement from the publisher, at the following address:
https://geobgu.xyz/web-mapping2/
In addition to the content of the printed version, the online version includes live versions and downloadable code for all ninety-plus complete examples (Appendix B) and exercise solutions (Appendix C), as well as additional appendices with instructions for setting up an SQL API (see Section 9.2.3) and a static server using R.
0.9 Acknowledgments
I thank the creators and contributors of the open-source tools used in this book, namely Leaflet, Turf.js, Leaflet.heat, and Leaflet.draw (Table 0.2). Vladimir Agafonkin, the creator of the Leaflet web-mapping library, deserves special mention here. Leaflet took open-source web mapping to a new level: for me to write this book, and for readers to enter the field of web mapping, would have been much more difficult without Leaflet. I am also grateful to Yihui Xie, whose bookdown (Xie 2018, 2016) R package (R Core Team 2018) greatly facilitated the technical process of writing the book.
Figure 6.1 was prepared using R packages sf (Pebesma 2018) and rworldmap (South 2011). Figure 7.1 and the images inside Tables 7.2–7.6 were also prepared using package sf. Figure 8.4 was prepared using R package RColorBrewer (Neuwirth 2014). Figures 8.3 and 9.2 were prepared using QGIS (QGIS Development Team 2018). The sample database shown in Figure 9.1 was prepared using data from R package nycflights13 (Wickham 2018). Figures 6.2 and 6.3 display images of OpenStreetMap tiles (© OpenStreetMap contributors).
I would like to thank Rob Calver and Lara Spieker from CRC Press for working with me and supporting this project, starting from a talk with Rob at a conference in Brussels in summer 2017, going through project initiation, the professional review process, and up to finalizing the manuscript and bringing it to press. I also thank Annie Sophia, Vaishali Singh and Jyotsna Jangra for the professional proofreading and production of the book. Shashi Kumar and John Kimmel from CRC are acknowledged for their assistance in technical issues.
This book is based on the materials of the course Introduction to JavaScript for Web Mapping, given by the Department of Geography, Ben-Gurion University of the Negev, each year during 2018-2021. I am grateful to Prof. Tal Svoray and Prof. Itai Kloog from the department for their guidance and encouragement during the development of course materials, and to the students for valuable feedback. I thank Shai Sussman and three anonymous reviewers for comments that greatly helped improve the manuscript.
Several figures in the book include icons from external sources: “computer,” “web page,” and “car” icons by Freepik, “folder” and “database” icons by Smashicons, “gears” icon by Good Ware, from https://www.flaticon.com/, licensed by CC 3.0 BY.
References
Based on the StackOverflow survey for 2022 (hhttps://survey.stackoverflow.co/2022/#most-popular-technologies-language).↩︎
There is no clear definition of the term modern web browser, but older versions of Internet Explorer are, arguably, not considered as modern browsers and thus not recommended to illustrate web development (https://teamtreehouse.com/community/what-is-a-modern-browser).↩︎