Chapter 13 Collaborative Mapping
Last updated: 2023-01-05 18:18:21
13.1 Introduction
In this chapter, we demonstrate the construction of a special type of web maps—web maps for crowdsourcing of spatial data. Crowdsourcing web maps are used to collect, permanently store, and display spatial information contributed by numerous users. The scale of crowdsourcing can widely vary—from a web map intended for a short-term survey taken by a class or group of co-workers, up to massive collaborative projects such as OpenStreetMap where >1000 GB of information have been collected103.
While implementing a crowdsourcing web map, we are going to learn several new concepts and techniques, including map controls for drawing (“digitizing”) vector layers (Section 13.3), using a submission form (Section 13.5), and using POST requests for sending information to a database (Section 13.6).
13.2 Crowdsourcing
Crowdsourcing is the idea of using the power of the crowd to collect data, as an alternative to other methods, such as using data from the government or from commercial companies. The main advantages of crowdsourcing are free access to the data for all, and the ability to keep the data up-to-date. The disadvantages are unequal coverage and the risk of sabotage.
The most well-known example of crowdsourcing is Wikipedia, an encyclopedia created and edited by volunteers throughout the world, operating since 2001. The OpenStreetMap (OSM) project, inspired by Wikipedia, was launched in 2004 to implement the idea of crowdsourcing in the field of spatial data and mapping. The aim of OSM is to create and maintain a single up-to-date digital map database of the world, through the work of volunteers, as an alternative to proprietary, out-of-date and fragmented data, predominantly used in the past. The OSM project is a big success: in many places, such as the U.S. and Western Europe, the level of detail and quality in OpenStreetMap is as good as commercial and government data sources.
From the technical point of view, crowdsourcing requires at minimum an interface where the contributors can log in and give their input, and a database where the inputs of the various contributors are being permanently stored. A crowdsourcing application needs to be simple, accessible, and intuitive, in order to reach the broadest audience possible. A crowdsourcing application for collecting spatial data, for example, needs to be intuitive not just to GIS professionals, but also to the general public. Web applications are a good fit for crowdsourcing due to their accessibility. For example, OSM has numerous editing interfaces, known as editors. Currently, the web-based iD editor (Figure 13.1) is considered the default OSM editor and is responsible the largest share of OSM edits.
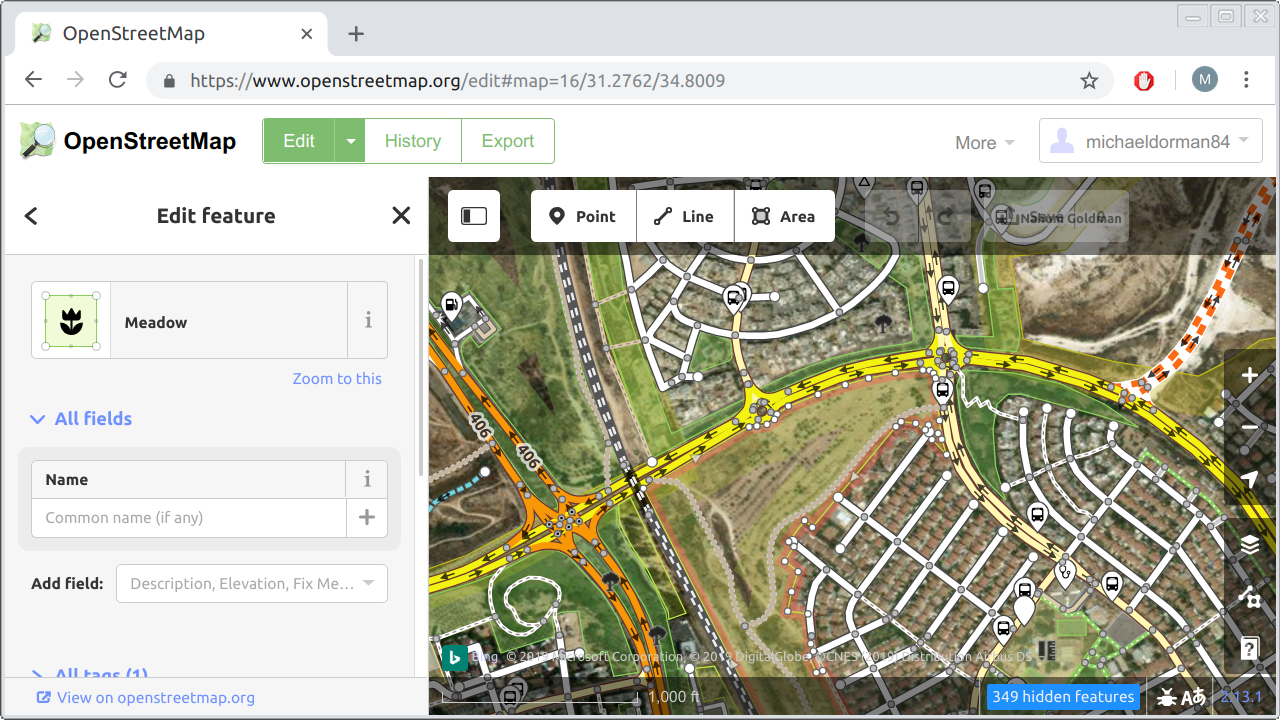
FIGURE 13.1: The iD editor, a web application for editing OpenStreetMap data
In this chapter, we are going to build a simple crowdsourcing web application. Unlike the iD editor, our crowdsourcing app will be quite minimal (Figure 13.9). For example, it will not have an authentication system or a complex input interface. However, the app we build will demonstrate the important concepts, which are:
- Having user input elements for collecting spatial data (e.g., digitizing)
- Communication with a database for persistently storing users’ input
We are going to build the crowdsourcing application in four steps:
- In
example-13-01.html, we will learn how to add a drawing control for drawing shapes on a Leaflet map (Section 13.3). - In
example-13-02.htmlandexample-13-03.html, we will learn about translating drawn shapes to GeoJSON (Section 13.4). - In
example-13-04.html, we will add a form where the user can enter attribute values along with the drawn shapes (Section 13.5). - In
example-13-05.html, we will add a mechanism for sending the drawn shapes to a database for persistent storage (Section 13.6).
13.3 The drawing control
The first thing we need for our crowdsourcing app is a vector editing toolbar. Using the toolbar, contributors will be able to draw shapes on the map, to be submitted and stored in a database later on (Section 13.6). To add an editing toolbar on top of a Leaflet map we will use the Leaflet.draw plugin.
We start with the basic map example-06-02.html from Section 6.5.11. First, we need to include the Leaflet.draw JavaScript and CSS files on our page. As usual, we will use local copies of the JavaScript and CSS files, placed in the js and css directories:
<link rel="stylesheet" href="css/leaflet.draw.css">
<script src="js/leaflet.draw.js"></script>
To load the files from a CDN, the above local paths can be replaced with the following URLs:
https://cdnjs.cloudflare.com/ajax/libs/leaflet.draw/1.0.4/leaflet.draw.css
https://cdnjs.cloudflare.com/ajax/libs/leaflet.draw/1.0.4/leaflet.draw.js
Like we did when including the Leaflet library (Section 6.5.7), using the local file option also requires downloading several image files. These images are necessary to display the icons in the drawing control (Figure 13.2). The files can be obtained from cdnjs.com, or from the online version of the book (Section 0.8). The image files need to be placed in the images directory inside the css directory.
Next thing we need to have is an editable layer on our map. The shapes in the editable layer are the ones that we can actually edit, or supplement with new ones we draw, using the drawing control:
let drawn_items = L.featureGroup().addTo(map);The editable layer, hereby named drawn_items, is a Feature Group object (Section 6.6.5). A Feature Group, in Leaflet, is similar to a Layer Group but with a few additional capabilities, which are beyond the scope of this book. For our purposes, both Layer Group and a Feature Group are used to combine several layers into one object, which facilitates actions such as clearing the map of all layers of a given type (Sections 7.6.5 and 10.5.3). In the present example, we are using a Feature Group only because it is required by the Leaflet.draw plugin. As shown in the above expression, a feature group is created and added to the map exactly the same way as a layer group, except that we are using the L.featureGroup function instead of the L.layerGroup function.
Initializing the drawing control itself is done as follows:
new L.Control.Draw({
    edit: {
        featureGroup: drawn_items
    }
}).addTo(map);
The new keyword is a way to create a new object in JavaScript, which we have not seen until now. This method is a little different from creating objects through calling a constructor function, which is what we did so far (e.g., using L.map, L.marker, etc., without the new keyword). The practical differences between the two initialization methods are beyond the scope of this book. Again, we are using the new initialization method only because the Leaflet.draw plugin requires it.
The above expression initializes the drawing control and places it in the top-left corner of the web map (Figure 13.2), similarly to the way that we initialized and added other types of controls throughout the book—a map description (Section 6.8), a legend (Section 8.6), an information box (Section 8.7.2), and a dropdown menu (Section 10.3). Upon initialization, the L.Control.Draw function accepts an options object where we can alter various settings to specify the structure and behavior of the drawing control. In our case, we set just one option: the fact that drawn_items is the Feature Group that stores all editable shapes.
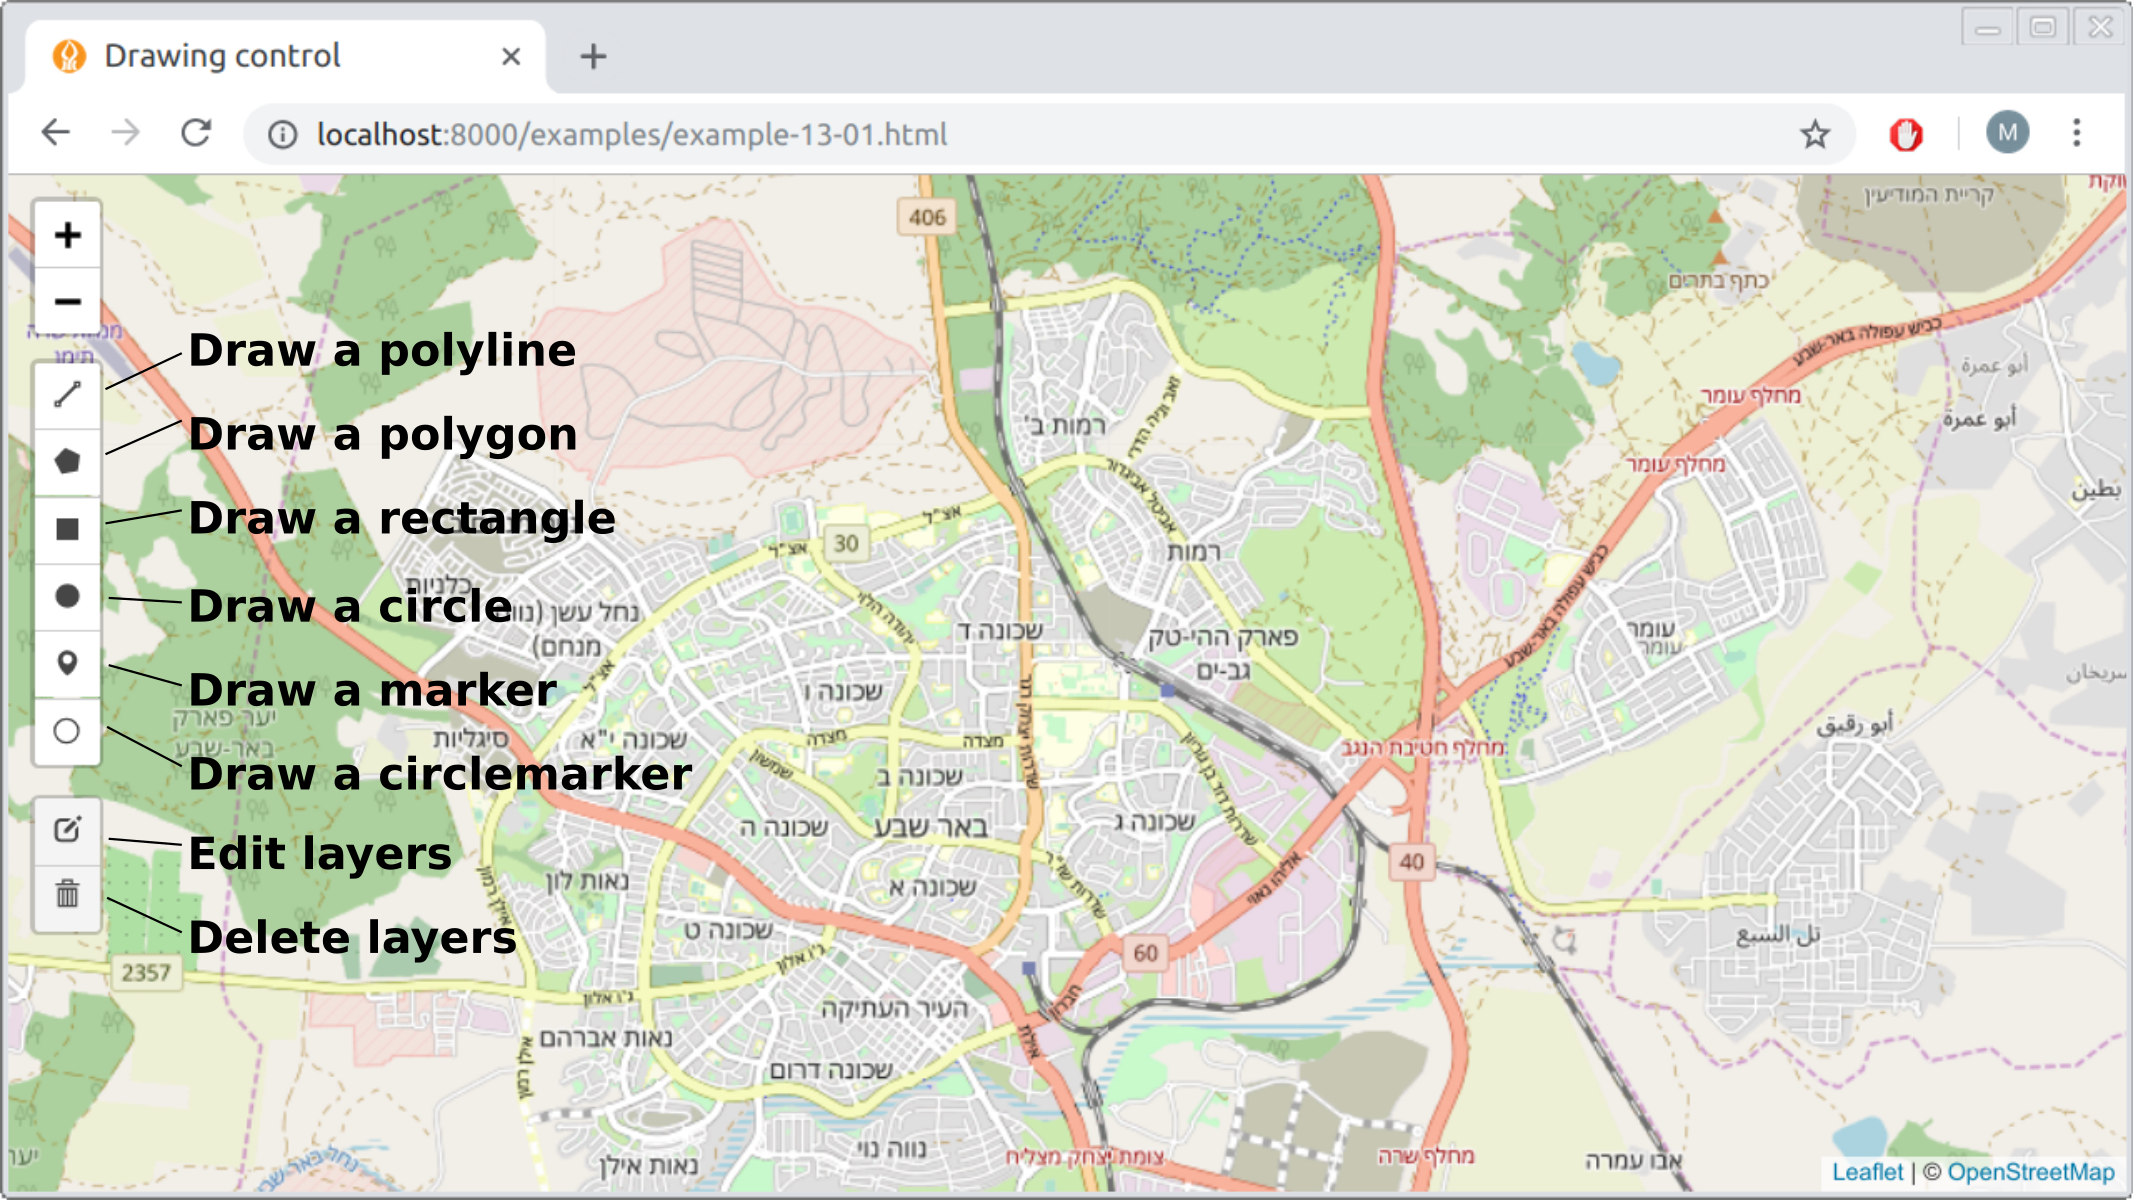
FIGURE 13.2: The Leaflet.draw control
If we added just the above two code sections, we would see the drawing control and could use it to draw shapes. However, once any of the shapes is finished it immediately disappears from the map. What we would usually like to have, instead, is that the drawn shapes persist on the map. That way, we can examine our creation: whether the drawing looks right, or whether we need to edit it further on. The key for setting up this behavior is the fact that interacting with the drawing control fires custom events, which we can listen to and respond to (Section 6.9).
For example, creating any new shape with the drawing control fires the draw:created event in the browser. Furthermore, the event object (Section 4.10) for the draw:created event contains a property named layer, which contains the newly drawn shape. Whenever the event fires, we can “capture” the newly drawn e.layer and add it to the drawn_items group, so that it persists on the map. This automatically makes the layer editable, since we set drawn_items as an editable group when initializing the drawing control (see above). The event listener for adding drawn shapes to drawn_items can be defined as follows:
map.addEventListener("draw:created", function(e) {
    e.layer.addTo(drawn_items);
});
Together, the last three code sections initialize a drawing control inside our basic map, and set an editable layer where the drawn items are “collected” and displayed on the map. The result (example-13-01.html) is shown in Figure 13.3.
FIGURE 13.3: example-13-01.html (Click to view this example on its own)
- Open
example-13-01.htmlin the browser.- Try drawing each of the six shape types: a line, a polygon, a rectangle, a circle, a marker, and a circle marker.
- Click on the edit layers button (Figure 13.2) to edit the shapes that you have drawn.
- Click on the delete button (Figure 13.2) to delete shapes.
- Inspect the
drawn_itemsobject, which contains the currently drawn shapes, in the JavaScript console.- Run the expression
drawn_items.toGeoJSON()to inspect the drawn shapes as GeoJSON.
13.4 Working with drawn items
13.4.1 Printing drawn items GeoJSON
In the previous example (example-13-01.html), each time a new shape was drawn it was simply added to our drawn_items Feature Group. As a result, the shape was displayed on the map, and we could subsequently edit or delete it, as well as draw any number of additional shapes. Our next step is to see how we can do something more with the drawn shapes. We will learn how to access the geometry of the drawn shapes, convert it to a GeoJSON string, and do something with it, such as to print it in the console.
In example-13-01.html, the currently drawn shapes were contained in the drawn_items Feature Group. To print the GeoJSON of the drawn shapes, the only place in the code we need to modify is the draw:created event listener. Instead of the original event listener definition (Section 13.3 above), we can use the following, expanded one:
map.addEventListener("draw:created", function(e) {
    e.layer.addTo(drawn_items);
    drawn_items.eachLayer(function(layer) {
        let geojson = JSON.stringify(layer.toGeoJSON().geometry);
        console.log(geojson);
    });
});
The novel part in this version is the second internal expression, starting with drawn_items.eachLayer. The .eachLayer method of a Feature Group (which a Layer Group also has), is a convenient method for doing something with each layer in the group. The .eachLayer method takes a function with one parameter (layer). The function is then applied to each of the layers in the object. This type of iteration should already be familiar; for example, the .forEach array method (Section 3.10.3.3) or the turf.clusterEach function from Turf.js (Section 12.5.2) are conceptually similar iteration methods. Conveniently, each layer in drawn_items is by definition a separately drawn shape104, since each layer was added when we finished drawing a shape, and the "draw:created" event was fired.
Inside the function, which is applied on each layer, there are two expressions:
let geojson = JSON.stringify(layer.toGeoJSON().geometry);
console.log(geojson);
These two expression actually do a lot:
- Converting the current
layerto GeoJSON with the.toGeoJSONmethod (Section 12.4.5) - Selecting just the
"geometry"property of the GeoJSON, using.geometry(Section 7.3.2) - Applying the
JSON.stringifyfunction to convert the GeoJSON geometry object to a string (Section 3.11) - Printing the string with
console.log
The resulting map (example-13-02.html) is shown in Figure 13.4. The screenshot shows the GeoJSON string printed in the console after one shape (a rectangle) has been drawn on the map.
FIGURE 13.4: example-13-02.html (Click to view this example on its own)
- Open
example-13-02.htmlin the browser.- Draw several shapes and inspect the output printed in the console.
13.4.2 Expanded GeoJSON viewer
As another example of doing something with the drawn shapes, we can now expand the GeoJSON viewer example-07-02.html (Figure 7.5) from Section 7.6. In that example, we had a text area where the user could type GeoJSON strings. When clicking “submit”, the typed GeoJSON string was turned into a Leaflet layer and displayed on the map. Now that we know how to work with the drawing control, we can implement the other direction too: letting the user draw new shapes on the map and making the GeoJSON strings of those drawn shapes appear in the text area (Figure 13.5).
To make things simple, we will decide the user can only draw one geometry at a time, and cannot edit or delete it after creation. To do that, we define the drawing control a little differently, with editing disabled:
new L.Control.Draw({
    edit: false
}).addTo(map);
The event listener we need to display the GeoJSON of drawn shapes inside the text area is as follows:
function show_text(e) {
    layers.clearLayers();
    let layer = e.layer;
    layer.addTo(layers);
    let geojson = JSON.stringify(layer.toGeoJSON().geometry, null, 4);
    document.getElementById("geojsontext").value = geojson;
}
map.addEventListener("draw:created", show_text);
The above code section binds a "draw:created" event listener to the map, implying that the show_text function will be executed each time a new shape is drawn. Let us review the code body of the show_text function, expression by expression:
layers.clearLayers()clears the map of all previously drawn shapes.let layer = e.layercaptures the last drawn layer, using the.layerproperty of the event object, and assigns it to a variable namedlayer.layer.addTo(layers)adds the last drawn layer to thelayerslayer group, which stores the layers to be displayed on the map.JSON.stringify(layer.toGeoJSON().geometry, null, 4)extracts the GeoJSON text string of the last drawn geometry. The additional(..., null, 4)parameters inJSON.stringifymake the output string indented and split into several lines (Section 3.11.2).$("#geojsontext").val(geojson)replaces the current contents of the text area with the GeoJSON string of the last drawn shape.
The new version of the GeoJSON viewer (example-13-03.html) is shown in Figure 13.5. The screenshot shows a line, created using the drawing control, and the corresponding GeoJSON that automatically appears in the text area.
FIGURE 13.5: example-13-03.html (Click to view this example on its own)
When experimenting with the translation of different types of shapes to GeoJSON in example-13-03.html, you may note two peculiar things:
- Markers, circles, and circle markers are all converted to
"Point"geometries, which means that the distinction between these three layer types is not recorded in the GeoJSON. - A circle is converted to a
"Point"geometry without the circle radius being recorded in the GeoJSON.
In other words, drawn markers, circles, and circle markers all become "Point" geometries when converted to GeoJSON, where their original shape type and radius are not being kept.
Another thing to note is that the Leaflet.draw plugin only supports single-part geometries. In other words, using Leaflet.draw you can only create "Point", "LineString", and "Polygon" geometries. The other four GeoJSON geometry types, including the multi-part geometries "MultiPoint", "MultiLineString", and "MultiPolygon", as well as "GeometryCollection", cannot be created105.
For simplicity and consistency with the GeoJSON format, which we are going to use to record drawn shapes and send them to the database, it therefore makes sense to only allow drawing of three shape types:
- Markers, which will be converted to
"Point"GeoJSON - Lines, which will be converted to
"LineString"GeoJSON - Polygons, which will be converted to
"Polygon"GeoJSON
Therefore, in the next two examples (Sections 13.5–13.6), we will restrict the drawing control to just these three shape types.
13.5 Submission form
In addition to the geometry, a crowdsourcing web application usually collects non-spatial attribute data too. For example, when contributing to OpenStreetMap, you typically draw (“digitize”) a geometry (a point, line, or polygon), then type in its non-spatial attributes, or tags in OSM terminology. For example, when adding a new building to the OSM data you may include the building=yes tag, specify building height with the building:height tag, and so on.
In our next example (example-13-04.html), we will include a simple form (Section 1.6.13), where the user enters a description and the contributor’s name. The description and name entered by the user are going to be sent to the database as non-spatial attributes, together with the GeoJSON representing the drawn geometry.
Like in the previous examples, the first thing we need is a drawing control definition. This time we will disable the buttons for adding circles, circle markers and rectangles. We keep the buttons for adding markers, lines, and polygons, which can be translated to "Point", "LineString", and "Polygon" GeoJSON geometries, respectively, without loss of information (Section 13.4.2):
new L.Control.Draw({
    draw : {
        polygon : true,
        polyline : true,
        rectangle : false,     // Rectangles disabled
        circle : false,        // Circles disabled
        circlemarker : false,  // Circle markers disabled
        marker: true
    },
    edit : {
        featureGroup: drawn_items
    }
}).addTo(map);
Our submission form will reside in a popup, conveniently appearing on top of the drawn shape once it is finished. The form contents will be defined with the following HTML code:
<form>
    Description:<br><input type="text" id="input_desc"><br>
    Name:<br><input type="text" id="input_name"><br>
    <input type="button" value="Submit" id="submit">
</form>
You can see what the form looks like in Figure 13.6.
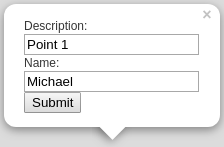
FIGURE 13.6: A form for collecting non-spatial attributes inside a Leaflet popup
Based on the above HTML code for creating the form, we can write a function called create_form_popup that binds and opens a popup with an editable form on the drawn_items feature group:
function create_form_popup() {
    let popup_content =
        '<form>' +
        'Description:<br><input type="text" id="input_desc"><br>' +
        'Name:<br><input type="text" id="input_name"><br>' +
        '<input type="button" value="Submit" id="submit">' +
        '</form>';
    drawn_items.bindPopup(popup_content).openPopup();
}
The create_form_popup function will be executed each time the user finishes to draw a shape, so that he/she can also enter the name and description and submit everything to the database. Accordingly, we have to modify the "draw:created" event listener, so that when done editing, the “submit” popup will open. Basically, we replace the drawn_items.eachLayer iteration inside the "draw:created" event listener defined in example-13-02.html, with a create_form_popup function call. That way, instead of printing the drawn shape GeoJSON in the console, an editable popup will open:
map.addEventListener("draw:created", function(e) {
    e.layer.addTo(drawn_items);
    create_form_popup();
});
The event listener for clicking the “submit” button triggers the set_data function. This is the part where we determine what to do with the drawn layer. Here is the definition of the set_data function:
function set_data(e) {

    if(e.target && e.target.id == "submit") {

        // Get user name and description
        let entered_username = document.getElementById("input_name").value;
        let entered_description = document.getElementById("input_desc").value;

        // Print user name and description
        console.log(entered_username);
        console.log(entered_description);

        // Get and print GeoJSON for each drawn layer
        drawn_items.eachLayer(function(layer) {
            let drawing = JSON.stringify(layer.toGeoJSON().geometry);
            console.log(drawing);
        });

        // Clear drawn items layer
        drawn_items.closePopup();
        drawn_items.clearLayers();

    }

}
The set_data function collects all of the user entered information into three variables, and just prints them in the console (for now):
entered_username—The text input from the#input_namefield of the popupentered_description—The text input from the#input_descfield of the popupdrawing—The geometry of each drawn shape, as GeoJSON
The first two inputs, entered_username and entered_description, are extracted from the text input area using the .value property (Section 4.8). The drawing variable is created a little differently, inside an .eachLayer iteration (Section 13.4.1). Using an iteration is essential, since the drawn_items feature group may contain more than one layer in case the user has drawn more than one shape. In such case, each layer is converted into a separate GeoJSON and separately printed in the console.
Finally, the set_data function is followed by the corresponding event listener:
document.addEventListener("click", set_data);Note that the event listener is binded to the document rather than to the “submit” button. The reason is that the popup is a dynamic element. For instance, the popup may be closed and re-opened when the layer is being edited. As a result, the event listener would have to be binded each time the popup re-appears. The solution here is different, relying on a mechanism known as event delegation. In the event listener function set_data, the for submission code is conditioned on the event target being the element that has id="submit", i.e., the button:
if(e.target && e.target.id == "submit") {...}The part e.target && e.target.id == "submit" means “check if e.target exists, and if it does check if its id is equal to "submit". Since the event listener is binded to the document, it persists even if the popup is closed (or even if it was not created yet). However, the event listener is not triggered by any click in the document, but only by clicks on the”submit” button.
In the resulting web map example-13-04.html (Figure 13.7), the user can draw one or more shapes with the drawing control. Each time a shape is drawn, a popup with the name and description text inputs is opened. Once the user decides to click “submit”, the name and description, as well as each GeoJSON for the drawn shapes, are printed in the console. Finally, the popup is closed, and the layer is removed from the map using the .closePopup and .clearLayers methods in the last two expressions.
One minor inconvenience is that the submission popup remains open while entering the “edit” or “delete” modes. This is counter-intuitive, as we should not submit the drawing while still editing it and making changes. The following code binds a few additional event listeners to close the popup when the user enters the “edit” or “delete” modes, and re-open it when done editing or deleting. This is accomplished using "draw:editstart", "draw:deletestart" event listeners combined with the .openPopup method on the one hand, and the "draw:editstop" and "draw:deletestop" event listeners combined with the .closePopup methods on the other hand.
As you can see in the code section that follows, the "draw:deletestop" event listener is slightly more complex: its internal code contains a conditional (Section 3.10.2) for checking whether the user has deleted all of the drawn shapes. In the latter case, running drawn_items.openPopup() would cause an error, since there are no layers to open the popup on. Therefore, a conditional is first being evaluated to verify that at least one layer remains when the user is done deleting. If there is at least one layer—the editable popup will open. If there are no layers left—nothing will happen; the user will see an empty map where he/she can draw new shapes once more.
map.addEventListener("draw:editstart", function(e) {
    drawn_items.closePopup();
});
map.addEventListener("draw:deletestart", function(e) {
    drawn_items.closePopup();
});
map.addEventListener("draw:editstop", function(e) {
    drawn_items.openPopup();
});
map.addEventListener("draw:deletestop", function(e) {
    if(drawn_items.getLayers().length > 0) {
        drawn_items.openPopup();
    }
});
The result (example-13-04.html) is shown in Figure 13.7.
FIGURE 13.7: example-13-04.html (Click to view this example on its own)
- Open
example-13-04.htmlin the browser.- Draw several shapes, then fill-in the name and description and press the “submit” button on the popup.
- Inspect the output printed in the console.
- Try editing or deleting some of the shapes, then pressing “submit” once more; the output printed in the console should always reflect the up-to-date drawn shapes as shown on the map.
13.6 Sending features to the database
13.6.1 Setting database permissions
In the last example (example-13-04.html), the drawn layers were not really sent anywhere, just printed in the console. Other than an input interface, to have a functional crowdsourcing application we also need a permanent storage location and a mechanism for writing user input into that location. Through the rest of this chapter, we will see how the drawn shapes can be sent to a the database on the demonstration server on geobgu.xyz, making the user input persistently stored, thus finalizing our crowdsourcing app.
Before we begin writing any JavaScript code for sending the data, we need to have a permanent storage location to collect the data. When using a relational database as permanent storage, what we need is an (empty) table in our database, having the corresponding columns and data types according to the data we intend to collect. On the server, we need to create a table with columns geom (geometry), description (string), and name (string). We call the new table beer_sheva. The corresponding SQL expression to create the beer_sheva table is as follows:
CREATE TABLE beer_sheva(
  geom geometry,
  description text,
  name text
);
Now, let us suppose that the crowdsourcing web map is ready and the user has drawn a point, which we decoded into the following GeoJSON string with JSON.stringify, like we do in example-13-04.html:
{"type":"Point","coordinates":[34.838848,31.296301]}Subsequently, let us also suppose that the user has filled the values "Point 1" and "Michael" into the description and name fields of the popup form (Figure 13.6), respectively. How can we actually insert these data into the newly created CARTO table? We can use the SQL INSERT INTO and VALUES keywords for inserting new data, as shown in the following SQL query example:
INSERT INTO beer_sheva (geom, description, name) VALUES (
  ST_SetSRID(
    ST_GeomFromGeoJSON(
      '{"type":"Point","coordinates":[34.838848,31.296301]}'
    ),
  4326
  ),
  'Point 1',
  'Michael'
);
The query looks quite long and complex, but note the high-level structure used to specify the column names and values to insert:
INSERT INTO beer_sheva(..., ..., ...) VALUES (..., ..., ...);The first three ... symbols are replaced with the column names where the values go into. The last three ... symbols are replaced with the values themselves. Note that the order of column names needs to match the order of values, so that the right value will be inserted into the right column. In the present example, the ordering of the first triplet (the column names geom, description, and name) matches the order of the second triplet after the VALUES keyword (the geometry, 'Point 1', and 'Michael').
To create the geometry value which goes into the geom column, the query makes use of the ST_GeomFromGeoJSON function to convert from GeoJSON into WKB. This is exactly the opposite of decoding the geometry column into GeoJSON text with ST_AsGeoJSON (Section 9.6.3). The ST_SetSRID function specifies that our GeoJSON coordinates are in lon/lat, i.e., in the WGS84 coordinate reference system which we work with throughout the book (Section 11.3), specified with the EPSG code 4326.
The corresponding SQL API query is given below:
https://geobgu.xyz/sql?q=
INSERT INTO beer_sheva (geom, description, name)
VALUES (ST_SetSRID(ST_GeomFromGeoJSON(
'{"type":"Point","coordinates":[34.838848,31.296301]}'
),4326),'Point 1','Michael')
This error message, as the phrase "permission denied" suggests, concerns the issue of database permissions, which we have not really considered yet. Any database, in fact, is associated with one or more database users, with each user having his/her own password and associated with a set of privileges, i.e., rules for what the user can and cannot do in the database. For example, an administrator may have the maximal set of privileges, meaning that he/she can do anything in the database: reading and writing into tables, creating new tables, deleting existing tables, adding or removing other users, granting or revoking privileges to other users, and so on. On the other hand, a read-only user may have limited “read-only” privileges, so that they can only consume content from the database but cannot make any changes in the tables, or in their own or other users’ privileges.
The way we accessed our CARTO database with the CARTO SQL API, in fact, implied a database connection with the default user named publicuser, which is automatically created by CARTO when setting up our account. The publicuser user has read permissions on all tables in our database, which is why we could execute any of the SQL queries starting with SELECT throughout Chapters 9–12. The publicuser, however, by default does not have write permissions. This is why the above INSERT query failed with a "permission denied" error.
In addition to publicuser, CARTO defines an API Key user, who has all possible privileges on the tables in the database: read, write, update, create, delete, and so on. To use the CARTO SQL API with the “API Key” user, we need to supply an additional api_key parameter in our query, as in:
https://geobgu.xyz/sql?q=
INSERT INTO beer_sheva (geom, description, name)
VALUES (ST_SetSRID(ST_GeomFromGeoJSON(
'{"type":"Point","coordinates":[34.838848,31.296301]}'
),4326),'Point 1','Michael')&
api_key=fb85************************************
The api_key is a long string, which acts like a password. You can get the API Key from your account settings panel in the CARTO web interface.
So, there are actually two possible solutions to the "permission denied" problem when trying to insert a new record into the beer_sheva table:
- We can connect to the database with the API Key user, who has maximal privileges and therefore can execute
INSERTqueries on thebeer_shevatable. - We can grant the
publicuseruser a new privilege, for executingINSERTqueries on tablebeer_sheva.
The first option may seem the most convenient, since the only thing we need to do is locate our API Key string in the CARTO interface and attach it in the SQL API query URL, as shown above. However, there is a serious security issue we need to consider when using this approach. If we include the API Key in our JavaScript code, in principle anyone looking into the source code of our page will be able to copy the API Key, and use it to make any kind of SQL query on our account, having maximal privileges. For example, if anyone wanted to, he/she could even permanently delete any table in our account using DROP TABLE command. Exposing the API Key in client-side scripts is therefore a serious security risk. The API Key is really intended only for server-side scripts, whose source code cannot be accessed by the web page users. For instance, the server-side script may accept requests with a password the user entered; if the password is valid the server can make a query to the CARTO SQL API and send back the result, otherwise the query will be rejected. This approach requires setting up a dynamic server (Section 5.4.3), which means that, to use it securely, the API Key solution is not so simple after all. In this book, we concentrate on client-side solutions, so we will not elaborate further on the API Key approach.
For a simple crowdsourcing app, intended for a trusted audience, the second option of granting INSERT privileges to publicuser is a simple and effective solution. In a way, this makes our database exposed: anyone who enters our web page will be able to insert new records into the beer_sheva table. On the other hand, the worst-case scenario is just that our table will be filled with many unnecessary records. The only privilege we will grant is INSERT, which means that publicuser cannot delete any previously entered records or modify the table in any other way. Moreover, when the URL for our page is shared with a trusted audience, such as among students taking a survey in a class, the chances of someone taking the trouble of finding our page and intentionally sabotaging our database by filling it with a large amount of fake records is very small. Thus, in small-scale use cases, the effort of making a dynamic server with an authentication system may be superfluous, since the simple solution presented below is sufficient.
To grant the permission for making INSERT queries on the beer_sheva table, the following SQL query needs to be executed. The publicuser obviously does not have the permission to grant himself/herself with additional privileges. Therefore the query needs to be executed inside the SQL editor on the CARTO web interface, which implies full privileges (Figure 13.8), or using the SQL API with the the API Key.
GRANT INSERT (geom, description, name)
  ON beer_sheva
  TO publicuser;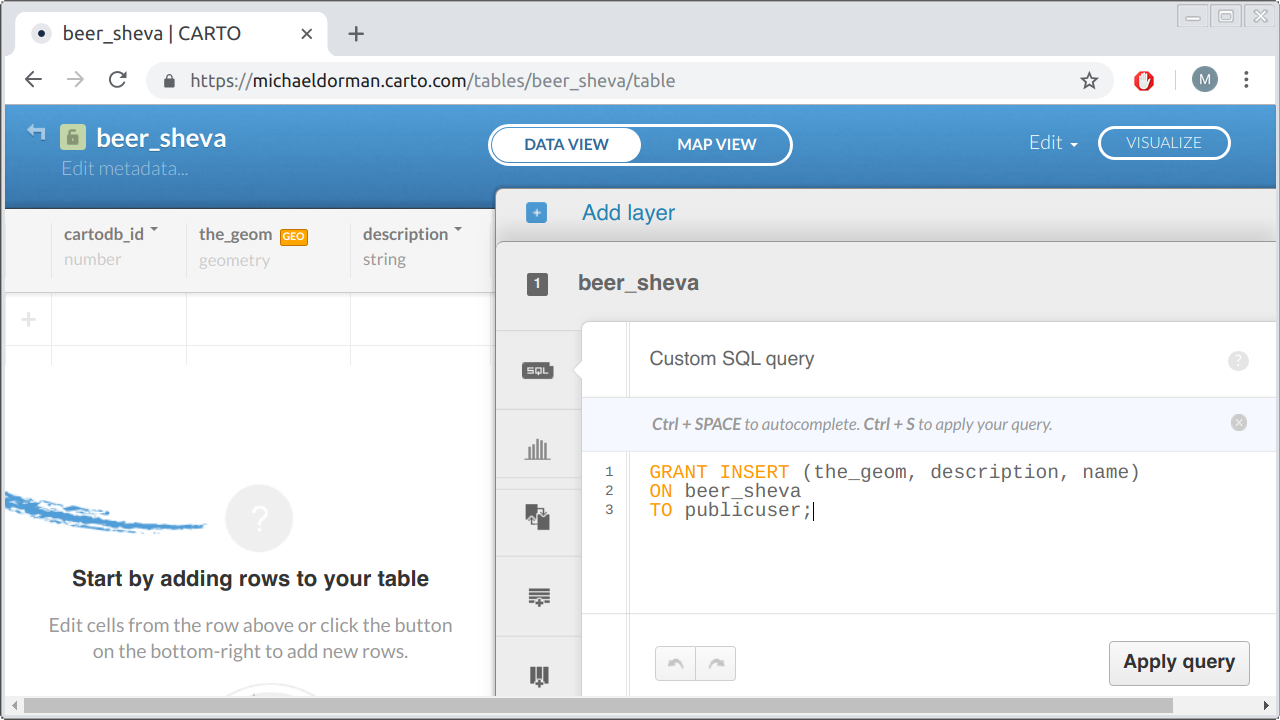
FIGURE 13.8: Granting INSERT permission through the CARTO web interface
After the query for granting new permissions is executed, the above INSERT API call, for adding a new record into the beer_sheva table, should work even without the API Key. In case you still see a message such as:
{"error":["permission denied for sequence beer_sheva_copy_cartodb_id_seq"]}you need to execute the following query too, either in the web interface or with the API Key106:
GRANT USAGE ON SEQUENCE beer_sheva_copy_cartodb_id_seq
  TO publicuser;
To disable the new permission, for example when data collection is completed and we do not want to accept any more entries into the beer_sheva table, we can always revoke the privilege granted to publicuser as follows:
REVOKE INSERT ON TABLE beer_sheva
  FROM publicuser;
After the beer_sheva table is created and the INSERT permissions are taken care of, the database is ready and waiting to receive the crowdsourced data. Now, let us move on to defining the web-map script for processing and sending the user-edited data to the database.
13.6.2 Adding the drawing control
Like in the previous examples, first thing we need in our script is to have a drawing control definition. We use the same definition from example-13-04.html (Section 13.5), with circles, circle markers, and rectangles disabled107:
new L.Control.Draw({...}).addTo(map);Next, in case we would like the map to display the previous shapes drawn by other users, we can set up a layer group named db_data to contain them:
let db_data = L.layerGroup().addTo(map);Accordingly, we need to load the items already contained in the beer_sheva table from previous editing sessions, using the following code section:
let url = "https://geobgu.xyz/sql?q=";
let sql_query = "SELECT geom, description, name FROM beer_sheva";
function addPopup(feature, layer) {
    layer.bindPopup(
        feature.properties.description +
        "<br>Submitted by " + feature.properties.name
    );
}
fetch(url + sql_query)
    .then(function(response) {
        return response.json();
    })
    .then(function(data) {
        L.geoJSON(data, {onEachFeature: addPopup}).addTo(db_data);
    });
Note that the popup for each of the loaded features displays the name and the description properties, which were entered in previous sessions when submitting drawn shapes and saved in the beer_sheva table.
Other than loading previously stored shapes using the above code, the major change compared to example-13-04.html is in the set_data function, which is responsible for saving the drawn shapes whenever the “submit” button is clicked. The new version is quite longer, since instead of just printing the data in the console it now sends the data for permanent storage in the database:
function set_data(e) {

    if(e.target && e.target.id == "submit") {

        // Get user name and description
        let entered_username = document.getElementById("input_name").value;
        let entered_description = document.getElementById("input_desc").value;

        // For each drawn layer
        drawn_items.eachLayer(function(layer) {

            // Create SQL expression to insert layer
            let drawing = JSON.stringify(layer.toGeoJSON().geometry);
            let sql =
                "INSERT INTO beer_sheva (geom, description, name) " +
                "VALUES (ST_SetSRID(ST_GeomFromGeoJSON('" +
                drawing + "'), 4326), '" +
                entered_description + "', '" +
                entered_username + "')";
            console.log(sql);

            // Send the data
            fetch(url + "?q=" + encodeURI(sql))
                .then(function(response) {
                    return response.json();
                })
                .then(function(data) {
                    console.log("Data saved");
                })
                .catch(function(error) {
                    console.log("Problem saving the data:", error);
                });

            // Transfer submitted drawing to the CARTO layer
            let new_data = layer.toGeoJSON();
            new_data.properties.description = entered_description;
            new_data.properties.name = entered_username;
            L.geoJSON(new_data, {onEachFeature: addPopup}).addTo(db_data);

        });

        // Clear drawn items layer
        drawn_items.closePopup();
        drawn_items.clearLayers();

    }

}
We will now go over the code, step by step.
The first two expressions are exactly the same as in example-13-04.html (Section 13.5). Again, these two expressions are used to extract the entered text in the name and description fields, as given at the precise moment when the “submit” button was clicked. The name and description values are assigned into variables named entered_username and entered_description, respectively:
let entered_username = document.getElementById("input_name").value;
let entered_description = document.getElementById("input_desc").value;
The central code block inside the set_data function is contained inside the .eachLayer iteration on drawn_items. As shown in example-13-02.html (Section 13.4.1) and example-13-04.html (Section 13.5), using .eachLayer we basically apply a function on each of the layers comprising drawn_items. The function has a parameter named layer, which is assigned with the current layer in each step of the iteration:
drawn_items.eachLayer(function(layer) {
    // Doing something with each drawn layer
});
What does the internal function in the .eachLayer iteration do in the present case of example-13-05.html? Three things:
- Construct the
INSERTquery for adding a new record into thebeer_shevatable - Send the query to the CARTO SQL API
- Copy the submitted drawing to the CARTO layer, to display it on the map
Here is the code for the first part, the SQL query construction:
let drawing = JSON.stringify(layer.toGeoJSON().geometry);
let sql =
    "INSERT INTO beer_sheva (geom, description, name) " +
    "VALUES (ST_SetSRID(ST_GeomFromGeoJSON('" +
    drawing + "'), 4326), '" +
    entered_description + "', '" +
    entered_username + "')";
console.log(sql);
This code section builds the SQL query for sending the currently iterated drawn shape to the database. Basically, instead of a fixed INSERT query, such as the one shown above ('Point 1' created by 'Michael'), we are constructing the query dynamically, using the three variables:
drawing—The GeoJSON string for the current layer, goes into thegeomcolumnentered_description—The description entered into the popup, goes into thedescriptioncolumnentered_username—The name entered into the popup, goes into thenamecolumn
The complete query is assigned into a variable named sql. Using console.log, the value of sql is then printed into the console, which is helpful when inspecting our web map for potential problems.
The second part of the code takes care of sending the SQL query contained in sql to the server:
fetch(url + "?q=" + encodeURI(sql))
    .then(function(response) {
        return response.json();
    })
    .then(function(data) {
        console.log("Data saved");
    })
    .catch(function(error) {
        console.log("Problem saving the data:", error);
    });
The query is sent as part of an Ajax GET request, containing the SQL expression to insert new data into the database. Depending on the complexity of the drawn geometry, the SQL expression can be infinitely long. Therefore, potentially, we may encounter browser limitations of URL length. The best practice to deal with this situation is to use a POST request instead of a GET request. The exact lower limit depends on the browser, but can be as low as 2048 characters. So, if the user has drawn a very complex geometry which results in a very long GeoJSON string, the resulting GET request may be rejected. In a POST request, the parameters are sent as part of associated data, rather than being part of the URL, which resolves the limitation. The fetch expression to send the same query using POST looks as follows:
fetch(url, {
        method: "POST",
        headers: {
            "Content-Type": "application/x-www-form-urlencoded"
        },
        body: "q=" + encodeURI(sql)
    })
    .then(function(response) {
        return response.json();
    })
    .then(function(data) {
        console.log("Data saved:", data);
    })
    .catch(function(error) {
        console.log("Problem saving the data:", error);
});
However, to make it work the server needs to be adapted to accept POST requests as well.
POST requests are more rarely used than GET and a little less convenient to work with (Section 5.3.2.3). However, POST requests are more appropriate when sending data to be processed on the server, as opposed to GET, which is mostly used to get data from the server. It is important to note that the CARTO SQL API can accept both GET and POST requests, so the same request can be achieved in both ways. In this case, however, making a POST request is safer because the URL in GET requests is limited in character length.
To make a POST request we are going to use the fetch function with slighly modified parameters. Until now, we have been extensively using fetch in Chapters 7–12for making GET requests. As mentioned in Section 7.7.3, however, the fetch function can also be used to make POST request. In our case, we need to make a POST request to the URL of the CARTO SQL API ("https://michaeldorman.carto.com/api/v2/sql"), with the sent data being the sql string and the data we expect back from the server being JSON. Finally, we specify what to do when the request is successful (success) or when it fails (error). In this case, we choose to simply print either the "Data saved" or the "Problem saving the data" string in the console.
The third part of the eachLayer iteration, inside our set_data function code body, transfers the drawn data to the db_data layer to display it on the map without reloading the map. Basically, the drawn layer is translated to GeoJSON, combined with the description and name properties, then added on the map with L.geoJSON. Without this part, our drawing would only be sent to the database without being shown on the map, unless we reload the web page:
let new_data = layer.toGeoJSON();
new_data.properties.description = entered_description;
new_data.properties.name = entered_username;
L.geoJSON(new_data, {onEachFeature: addPopup}).addTo(db_data);
Finally, outside of the .eachLayer iteration, we close the editable popup and clear the drawn_items feature group. The map is now ready for making a new drawing and sending it to the database.
drawn_items.closePopup();
drawn_items.clearLayers();
The complete crowdsourcing app (example-13-05.html) is shown in Figure 13.9.
FIGURE 13.9: example-13-05.html (Click to view this example on its own)
As of March 2019 (https://wiki.openstreetmap.org/wiki/Planet.osm).↩︎
The reason for using an iteration, rather than converting the entire Feature Group into a single GeoJSON, is that each geometry needs to be submitted as a separate entry in the database. This will become clear in our final example (Section 13.6.2).↩︎
If necessary, the drawn shapes can always be combined into their multi- counterparts programmatically, using JavaScript code. For example, the
turf.combinefunction from Turf.js (Chapter 12) can be used to combine geometries.↩︎Replace
beer_sheva_copy_cartodb_id_seqwith the exact name that was given in your error message.↩︎The
L.Control.Drawoptions were replaced with...to save space, see Section 13.5 for the complete code.↩︎